MAP Scores Are In — Now What? Your Week-by-Week Plan
The scores came in this morning. You opened the Learning Continuum, scrolled through three RIT bands worth of skill statements, and closed the tab. You’ll come back to it. Probably tonight, after dinner. Probably not tonight.
If that’s where you are right now, this post is the one that gets you unstuck. Not a philosophy of MAP data. Not a lecture on growth mindset. A week-by-week plan that starts Monday and ends with small groups running by the end of next week — built for K-5 teachers who already know how to teach and just need the bridge from “the scores are in” to “I know what I’m doing tomorrow.”
There’s a free score tracker at the bottom of the post. Grab it before you start Week 1.
Why MAP Data Feels Overwhelming (And Why That’s Not Your Fault)
The NWEA platform gives you a wonderful trove of data in a format that’s almost impossible to use under classroom pressure. The Learning Continuum is a great tool, and it’s also overwhelming. You’re not the only teacher who has stared at it and felt like the path from “RIT 162” to “what worksheet do I pull on Monday” was missing.
That gap is real. It’s not a personal failing, and it’s not because you don’t understand the test. It’s because the platform was built to measure growth, not to prescribe instruction. The translation from data to action is the work — and that’s what this plan walks through.
Here’s what’s on the other side of the next two weeks if you follow this:
- Three to four small groups running by the end of Week 2
- A simple tracker showing fall scores for every student in your room
- Targeted practice for each group that matches their actual RIT band
- Documentation you can hand to your principal or bring to your data team meeting
- A plan for the next progress check so you’re not starting from zero in winter
Before You Start: One Hour of Setup
Before Week 1 begins, set aside one hour — not in the evening, not during prep when something else will come up. Block it. This hour saves you the rest of the plan.
Pull two reports
From your NWEA login, pull the Class Report and the Student Profile reports for your class. The Class Report gives you the overview. The Student Profiles let you spot-check anything that looks off.
From your NWEA login, pull the Class Report and the Student Profile reports for your class. The Class Report gives you the overview. The Student Profiles let you spot-check anything that looks off. If you’ve never walked through a Student Profile before, the step-by-step report walkthrough covers what each section means.
Get the score tracker
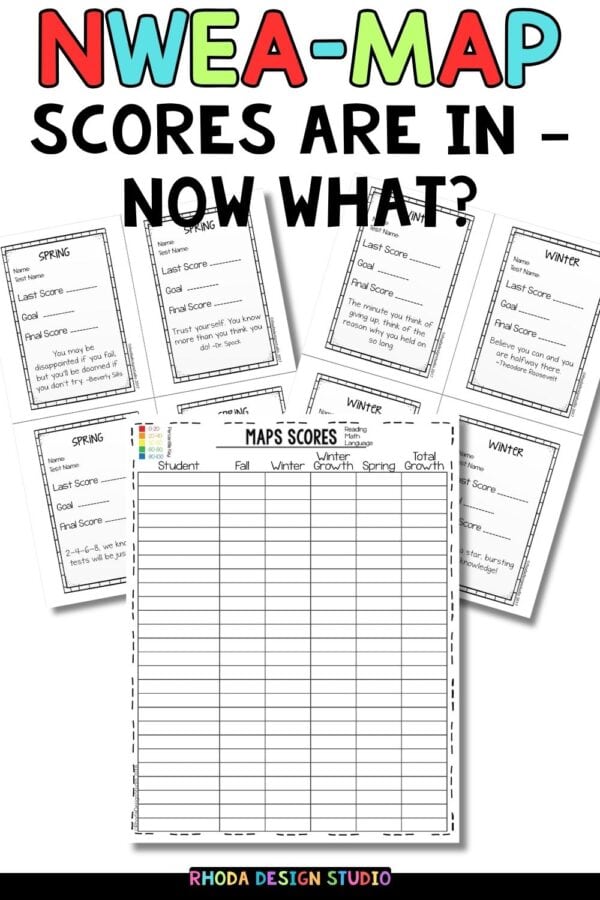
Print or open the free score tracker (linked at the bottom of this post). It’s one page per class with columns for fall, winter, and spring scores plus a notes column. The point is one document you can read in 10 seconds before a small group starts.
Drop scores into the tracker
Just the fall scores. Math and reading separately. Don’t try to interpret yet, don’t group yet, don’t plan yet. Just transcribe. This is the boring step that everything else depends on.
If you have 25 students and you find yourself thinking “I am spending hours of my life on this” — stop. The setup hour is one hour. If it’s taking longer, you’re trying to interpret while you transcribe. Just write the numbers down. Interpretation is Week 1.
Week 1: Read the Data Without Acting On It
Week 1 is for looking, not doing. The instinct after MAP scores arrive is to immediately rebuild your small groups, redo your stations, start a new intervention. Don’t. Most of what looks like a clear pattern in fall data is a single bad testing day, a confused student, or a kid who clicked through the last 10 questions to get to recess.
Day 1: Identify your three groups
Look at your tracker. You’re going to identify three groups, no more:
- The lowest band: students roughly 10 RIT points or more below your grade-level mean
- The middle band: students within about 10 points of your grade-level mean
- The high band: students roughly 10 points or more above your grade-level mean
That’s it. You can refine later. Three groups is the maximum a regular classroom teacher can sustain across a week without burning out. If you’re not sure what counts as the ‘grade-level mean’ or how percentile cutoffs map to RIT bands for your grade, the grade-level RIT breakdown covers the norms and percentile bands. If you’re an interventionist pulling groups across grade levels, you’ll group differently — see the section on band-based grouping below.
Day 2: Spot-check the outliers
For any student whose fall score surprised you — way higher or way lower than you expected — pull their Student Profile and check three things:
- Did they finish the test, or did they speed through the last items?
- Is their score consistent with last spring’s score plus normal summer regression?
- Are their domain scores wildly uneven (high in one area, low in another)?
Outliers aren’t always bad data, but they’re worth a 60-second check before you build instruction around them.
Day 3: Pick your priority skill per group
For each of your three groups, pick ONE priority skill to start with. Not five. One. The Learning Continuum gives you skill statements at every RIT band — you’ll be tempted to address all of them. Don’t.
For your lowest band, pick a foundational skill that’s a clear gap. For your middle band, pick the on-grade-level skill that you know multiple kids are missing — and use what’s actually being taught this quarter (more on that below). For your high band, pick an extension skill from the band above where they tested.
Write the skill at the top of your tracker. That’s what Week 2 small groups practice.
Days 4-5: Pull materials, don’t make them
This is the trap that eats Week 1. Teachers see the data, identify the priority skills, and then start building practice materials from scratch. By Friday, no small groups are running because they spent the week designing worksheets.
Pull, don’t build. Use what you already own — your math curriculum has fluency pages by skill. Your reading program has decodable passages by phonics pattern. If you don’t have something that matches the right RIT band, that’s where pre-organized RIT-aligned worksheet sets help. The point is: you don’t need to invent anything in Week 1. You need to find what you already have and put it in three piles.
What’s Actually Being Taught This Quarter
The mistake most fall MAP plans make is treating intervention as separate from grade-level instruction. It isn’t. The kids in your low band still need access to the on-grade-level lesson. Your intervention work fills in the prerequisite skills that lesson assumes.
Here’s a quick reference for what most K-5 classrooms cover in Q1 (the first nine weeks of school) so you can match your intervention to what’s actually happening in core instruction:
Q1 Math by Grade
- Kindergarten: Counting to 20, number recognition, comparing sets, one-to-one correspondence, beginning addition with objects
- 1st Grade: Add and subtract within 10, count to 120, intro to place value
- 2nd Grade: Add and subtract within 20 fluency, place value to 1,000
- 3rd Grade: Multiplication and division concepts, properties of operations, fact fluency
- 4th Grade: Place value to 1,000,000, multi-digit addition and subtraction, intro to multiplication
- 5th Grade: Place value with decimals, multi-digit multiplication
Q1 ELA by Grade
- Kindergarten: Letter sounds and recognition, ask and answer questions about texts, phonemic awareness, rhyming
- 1st Grade: Ask and answer questions, print concepts, blending phonemes, long and short vowels, end punctuation
- 2nd Grade: Ask and answer (5W’s), long and short vowels in single-syllable words, vowel teams, character response
- 3rd Grade: Ask and answer with text references, character traits and motivations, prefixes and suffixes, multisyllable words
- 4th Grade: Inferences with text evidence, story elements in depth, complete sentences, syllabication and morphology
- 5th Grade: Quote accurately to support inferences, compare and contrast characters, conjunctions and prepositions, fluency at grade-level texts
Use this as the lens when you pick your priority skill. If your 3rd grade middle group tested at RIT 185, the relevant Q1 priority is multiplication concepts — not something three units ahead. If your 1st grade low group tested at RIT 145, your priority is letter sounds and blending, which is also what’s happening in core phonics instruction.
Week 2: Run the Groups
Week 2 is when small groups start. The temptation now is to over-engineer the schedule. Resist. The goal is not the perfect rotation — the goal is groups running, kids practicing the right skill, you collecting one data point per student by Friday.
Day 1: Run group one
Pick one group to start with — usually the lowest band, because they need it most and they’re the smallest group. Pull them for 15 minutes. Use your priority skill. Take quick notes on who got what.
Day 2: Run group two
Same structure. Different group. Same 15 minutes. Notes.
Day 3: Run group three, then re-evaluate
By Wednesday you’ve run all three groups once. Look at your notes. Which group needs more time? Which kid is in the wrong group? Adjust on Thursday and Friday. The first week of running groups is always messy — that’s expected, not a sign you’re doing it wrong.
Days 4-5: Repeat with the most-needed group
Whichever group most needs another touch, pull them again. Not all three groups get equal time — that’s a myth that wastes everyone’s hour. The lowest band usually needs three sessions a week. The middle band usually needs two. The high band can often do their extension work independently after a 10-minute launch with you.
Grouping by RIT Band Instead of Grade Level
If you’re a classroom teacher, your three groups are within your class. If you’re an interventionist or pull-out specialist, your groups span grade levels — and band-based grouping changes everything.
A 4th grader at RIT 175 in math and a 2nd grader at RIT 175 in math need almost the same instruction. They’re working on the same skill cluster. The grade level is irrelevant for the 20 minutes you have them. Group by band. The materials match the band, not the grade.
This is the shift that makes interventionist time productive instead of fragmented. Worksheets and task cards organized by RIT band — rather than by grade — make this practical. You pull from the 171-180 folder regardless of who’s at the table. The RIT Intervention System is built around this exact approach: every worksheet, task card, and intervention pack is pre-organized by band so the planning is already done.
Stop the guessing game….
When parents and teachers see the same roadmap, everything changes for the child in between.

For the full index of all K-5 RIT bands, see RIT Band Activities.
Documentation: What to Bring to Your Data Meeting
If your school does data team meetings, your principal will ask you what you’re doing about the kids who didn’t grow. Here’s what you bring, formatted to fit on one page:
- Your tracker: fall scores by student, with the priority skill noted next to each group
- Your group rosters: which kids are in which band, and the rationale
- Your weekly schedule: when you’re pulling each group and for how long
- Your progress monitoring plan: how often you’ll check in (every 2 weeks is the standard for Tier 2)
That’s a one-page document showing you read the data, made decisions, and have a plan. It’s enough for MTSS, IEP, or 504 documentation. It’s enough for the principal’s meeting. It’s enough.
The same documentation also makes parent conferences about MAP scores far easier — you walk in with the same one-page reference your principal sees.
A Quick Map of K-5 RIT Bands
Most K-5 students fall somewhere between RIT 121 and RIT 230. Here’s the rough shape of what students at each band cluster are working on, so you can match your priority skill to your group’s actual instructional level. For deeper, band-by-band breakdowns with specific activities, see the math and reading fluency posts linked at the end of each section.
RIT 121-140: Pre-Numeracy and Letter-Level Skills
Math at this band is counting with meaning, numeral recognition, and basic shapes. Reading is letter recognition, beginning sounds, and matching letters to pictures. Practice should be physical, short, and concrete — manipulatives over worksheets.
RIT 141-170: Early Numeracy and Phonics
Math here covers number sequencing within 20, addition and subtraction within 10, simple story problems, and beginning ten-frame work. Reading covers blending sounds, sight words, rhyming, CVC patterns, and ask-and-answer questions about texts. Practice can move from fully concrete to representational (pictures and ten frames).
RIT 171-200: Operations Within 100 and Reading Fluency
Math at this cluster includes addition and subtraction within 20 and 100, place value to two and three digits, basic measurement and time, and the start of multiplication as repeated addition. Reading covers multisyllable words, fluency at sentence and short-paragraph level, main idea, character traits, and context clues. This is the on-grade-level cluster for most 1st through early 3rd graders.
RIT 201-230: Multi-Digit Operations and Inference
Math includes regrouping with two and three digits, multi-step word problems, multiplication and division facts, fractions, and elapsed time. Reading covers point of view, inference, text structure, figurative language, and reference materials. This is the on-grade-level cluster for most 3rd through 5th graders.
For activities and routines broken down into 10-point bands, see the deeper resources: math fluency activities by RIT band and reading fluency activities by RIT band.
Free MAP Score Tracker
The score tracker is a one-page-per-class document with columns for fall, winter, and spring scores. It includes:
- A simple roster row per student
- Math and reading columns side by side
- A growth column to track fall-to-winter and winter-to-spring movement
- Notes space for grouping and priority skills
- A version formatted for MTSS documentation
Drop your email below and the tracker comes to your inbox.
Frequently Asked Questions
What does a RIT score actually mean?
A RIT score is an instructional level on the NWEA scale, not a grade level. It tells you what skills a student is ready to learn next. Two students at the same RIT in math need similar instruction, even if they’re in different grades.
How do I read my student’s MAP report?
The Student Profile shows the overall RIT score, the score broken down by domain (operations, geometry, etc.), and the percentile compared to the national norm. Start with the overall score, then check whether the domain scores are even or uneven. Uneven domains tell you where to focus.
How do I group students using RIT bands?
For most classrooms, three groups is the maximum: low band (about 10+ points below grade mean), middle band (within 10 points), high band (about 10+ points above). For interventionists working across grade levels, group by band itself rather than by grade — kids at the same RIT need similar work.
How often should I progress monitor?
Every two weeks is standard for Tier 2 intervention. Use a quick fluency check or skill-specific probe — not a full MAP retest. The point is to see if the practice is working and adjust groups before winter MAP.
What if my student’s RIT score doesn’t match their grade level?
That’s the whole point of the RIT scale. A 3rd grader at RIT 175 needs 175-level instruction, regardless of what the grade-level expectation says. The data team meeting is where you document this gap and the plan to close it. The instruction in your small group is what closes it.
Can I use MAP data for IEPs?
Yes. MAP data is a valid academic measure for IEP present-levels and goal-setting. Pair it with curriculum-based measures and your own observations. Most special education teams welcome it because it’s standardized and trackable across years.
How do I find the grade-level RIT norms?
NWEA publishes grade-level norms periodically and updates them every few years. Pull the most current norms document directly from the NWEA site — bookmark it once and refer to it for fall, winter, and spring comparisons rather than memorizing numbers that may change.
Save This Plan for Later
Pin this so you can come back to it the next time MAP scores arrive — winter and spring rounds work the same way, just with growth comparisons added.
Final Thoughts
You don’t need to do something heroic with MAP data. You need to do the next correct thing. Hour of setup. Week of looking. Week of running three groups. By the time winter testing arrives, you’ll have weeks of practice notes, real progress monitoring, and a plan you can defend to anyone who asks.
Grab the score tracker, block your setup hour this week, and start. The plan only works if it starts.