What RIT Score Should My Student Have? A Plain-Language Guide for Teachers and Parents
You’re holding a MAP report (or you just got a number from your child’s teacher) and the question won’t go away: is this score okay? Not in a “should I worry” way necessarily. More in a “what does this number actually mean” way. The score sits there as a three-digit number with no obvious context.
This post answers the question. It’s written for both parents who got a MAP score in the family report and teachers who need to explain those scores to parents. The short answer is “it depends on the grade and the season” — but the longer answer is what makes the score actually useful, and that’s where most explanations stop short.
There’s a free score tracker at the bottom of the post if you want to keep track of fall, winter, and spring scores in one place.
First: There’s No Single “Right” RIT Score
RIT scores don’t work like grade-level reading scores or letter grades. There isn’t a number a 3rd grader is supposed to hit. RIT is a measurement scale that places every student on the same continuum from kindergarten through high school. A 3rd grader and a 7th grader can both have a RIT of 200 — that doesn’t mean they’re at the same place academically; it means they answered items of similar difficulty correctly.
What the score does give you is a comparison point. NWEA publishes norms — average scores by grade and testing season — based on national samples of students. Your student’s score, compared to the norms, tells you where they fall on the curve compared to peers nationally.
Three things to keep in mind before you compare:
- The norms are averages, not targets. Half of all students score below the average by definition.
- The norms are seasonal. Fall, winter, and spring norms are different. Comparing a fall score to a spring norm is not a fair comparison.
- The norms are updated periodically. NWEA released updated norms in 2025 — older comparison numbers may no longer be accurate.
How to Find Your Student’s Comparison Point
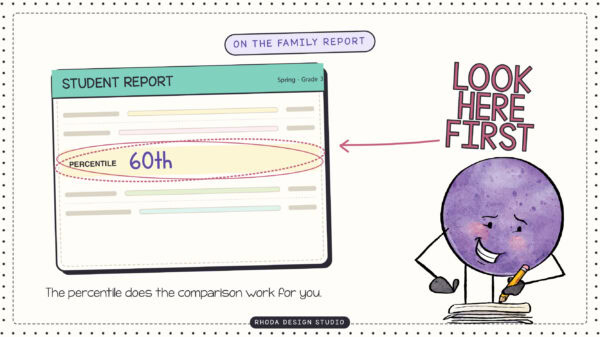
If you have your student’s MAP report in front of you, the comparison work is already done — and it’s the most useful number on the page. It’s called the percentile rank.
What the percentile actually tells you
The percentile shows where your student falls compared to peers in the same grade, taking the test in the same season. A 3rd grader at the 60th percentile in fall outscored 60% of 3rd graders nationally who tested in fall.
The percentile is more useful than the RIT score itself for the “is this okay” question because it does the comparison automatically. You don’t have to look up the norm — the percentile already factored it in.
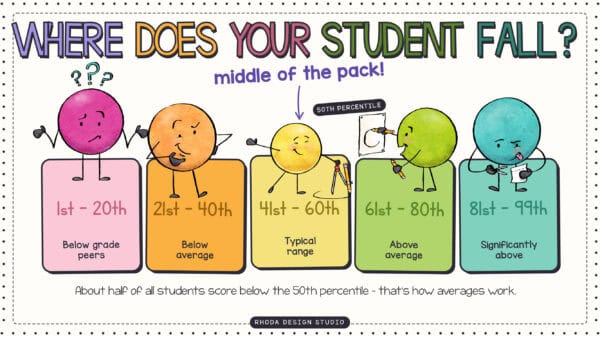
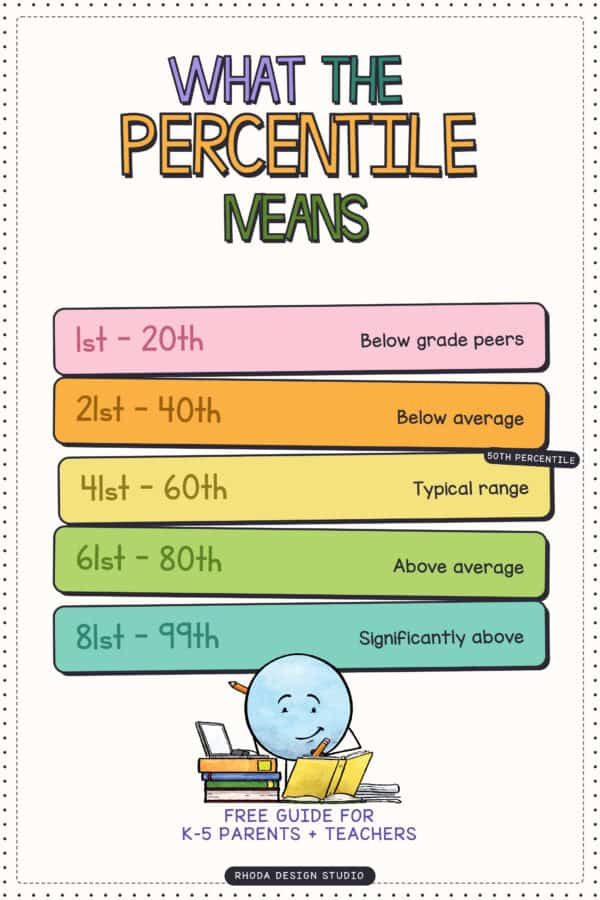
Rough percentile bands
- 1st-20th percentile: Significantly below grade-level peers. Often triggers Tier 2 or Tier 3 intervention review.
- 21st-40th percentile: Below average for grade. Worth monitoring; may need targeted support in specific skill areas.
- 41st-60th percentile: Within the average range. Roughly half of students fall in this band.
- 61st-80th percentile: Above average. The student is outperforming most peers in the grade and season.
- 81st-99th percentile: Significantly above grade-level peers. May benefit from extension or enrichment.
These are general bands and shouldn’t be used as the only data point for any decision. A student at the 22nd percentile with a strong upward trajectory across testing windows is in a different situation than a student at the 22nd percentile who has dropped from the 45th. Trends matter as much as snapshots.
Where to Find the Current NWEA Norms
The most accurate, current grade-level RIT averages come directly from NWEA’s published norms document. NWEA updates norms every few years; the most recent update was 2025. Bookmarking the official document is more reliable than memorizing numbers from any blog post — including this one.
The norms document includes:
- Average RIT scores by grade (K through 12) for fall, winter, and spring
- Standard deviations so you can see the range of typical scores around the average
- Percentile lookup tables — convert any RIT to a percentile and back
- Reading and Math scales separately
- Growth norms (average growth from one testing window to the next, by starting RIT)
Search “NWEA norms” and pull the current document directly from their site. The reason for not pasting numbers here: norms documents update, and once a number is in a blog post, it lives there forever — including the years when it’s no longer accurate.
What to Do If Your Student’s Score Is Below the Average
About half of all students score below the average. That’s how averages work. If your student’s score is below the norm, it doesn’t automatically mean something is wrong — it means they’re in the half of the distribution that scored below the midpoint that day.
That said, here’s how to think about a below-average score:
Just below the average (35th-49th percentile)
This is within the typical range. Most teachers would not flag this for intervention based on a single test. Look at the domain breakdown to see if there’s a specific area to focus on (e.g., a student strong in reading literature but weaker in informational text). Otherwise, this is a normal score.
Notably below the average (21st-34th percentile)
This is the band where teachers and parents often start asking “should we be doing something extra?” The honest answer is: maybe, depending on the trajectory. A student who scored at the 28th percentile in fall and the 32nd in winter is moving in the right direction. A student who scored at the 45th in fall and dropped to the 28th in winter is the one to watch.
Significantly below the average (below 20th percentile)
This is the band where most schools trigger Tier 2 or Tier 3 intervention review. If your student is here, the school’s MTSS or RTI process should already be involved. If you’re a parent and the school hasn’t reached out, ask. If you’re a teacher, this is the band where targeted small-group work matters most — and where the right materials at the right RIT level make the biggest difference.
For teachers building those small groups, the RIT Intervention System organizes practice materials by RIT band rather than by grade level — so a 3rd grader testing at RIT 165 gets work matched to where they actually are, not where their grade level says they should be.
What to Do If Your Student’s Score Is Above the Average
An above-average score is not a green light to stop paying attention. Two patterns are worth watching:
- Above-average overall, but uneven by domain. A 4th grader scoring at the 75th percentile overall might still be at the 35th percentile in one specific domain. The high overall score can mask a real gap.
- Above-average but flat growth. A student who consistently scores above the norm but isn’t growing as expected is a candidate for enrichment or extension work — they may not be challenged at their current instructional level.
For above-average students, the question shifts from “what’s wrong” to “are they being challenged enough.” That’s a different conversation, but it’s the same data driving it.
Why Two Students With the Same Score Can Need Different Things
Two students at RIT 185 in math might need very different instruction. Here’s why:
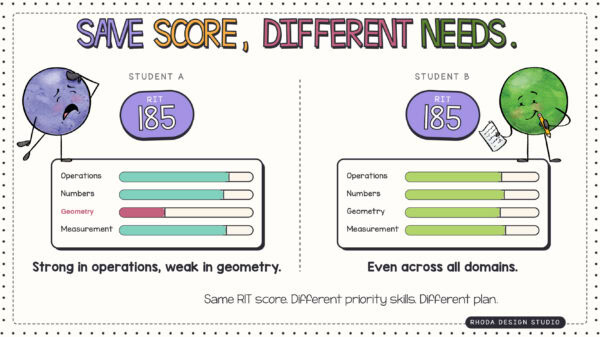
- Different domain breakdowns. One student got to 185 by being strong in operations and weak in geometry. The other got there by being even across all domains. Same overall score, different priority skills.
- Different trajectories. One student was at 165 last spring and grew to 185. The other was at 195 last spring and dropped to 185. Same current score, different stories.
- Different grade levels. A 3rd grader at 185 is at one percentile; a 5th grader at 185 is at a very different percentile. The score is identical; the comparison context isn’t.
This is why the score is a starting point for instructional decisions, not a verdict. The RIT tells you where to begin. The percentile tells you how that compares to peers. The domain breakdown and the trend line tell you what to actually do.
For Parents: How to Read the Family Report
If you got a MAP family report from your child’s school, here’s what to look at, in order:
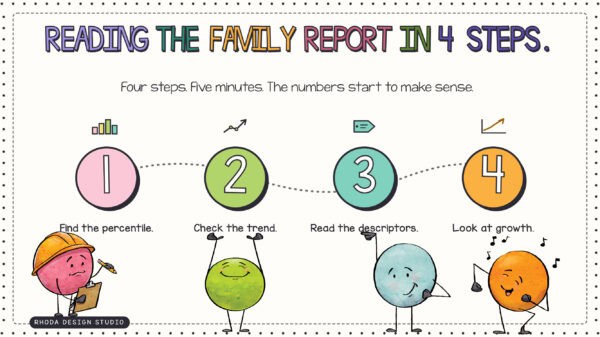
- The overall RIT score and percentile for math and reading. The percentile is your “is this okay” answer.
- The growth from the previous testing window (if it’s not the first test of the year). Did your child grow? By roughly the expected amount?
- The achievement level descriptors. Family reports often label achievement as “low average,” “average,” “high average,” etc. — that’s the percentile band translated into plain language.
- The growth percentile. Achievement tells you where your child is. Growth tells you whether they’re improving faster, slower, or about the same as similar peers.
What NOT to do: don’t try to map the RIT score to a grade level. The score isn’t designed for that. If your 3rd grader scored RIT 215, that doesn’t mean they’re “reading at a 5th grade level.” RIT and grade level are different scales.
Questions to ask your child’s teacher
- What does this score tell you about what my child is ready to learn next?
- Are there specific skill areas (domains) where my child needs more support?
- What’s the plan for small-group instruction or intervention based on these scores?
- How can I support this work at home without making testing the focus?
These are better questions than “is my child behind” — and they get you more useful answers.
For Teachers: How to Talk to Parents About RIT Scores
Parent conversations about MAP scores are easier when you frame the score as instructional information rather than as judgment.
Lead with the percentile
Most parents don’t know what RIT means and don’t need to. The percentile answers their actual question: how is my child doing compared to peers? Lead with that. The RIT score is a tool you use; the percentile is the result that tells the parent something useful.
Show the trend, not just the snapshot
One score is a snapshot. Multiple scores show a story. If you can show fall, winter, and spring (or fall and winter at minimum), you change the conversation from “is my child behind” to “is my child progressing.” The second is the more useful conversation for both of you.
Be specific about what comes next
Parents don’t want general reassurance — they want to know what you’re doing and what they can do. “Based on this score, we’re working on multiplication fluency in our small groups twice a week. At home, anything you can do to keep math facts fresh — flash cards, math games, even just times-tables in the car — supports what we’re doing here.” That’s a five-sentence answer that respects the parent and the data.
Free MAP Score Tracker
The score tracker is a one-page-per-class document with columns for fall, winter, and spring scores plus seasonal goal cards. It includes:
- A roster row per student
- Math and reading columns side by side
- Notes space for priority skills and group placement
- Seasonal goal cards for fall, winter, and spring
- A version formatted for MTSS documentation
Drop your email below and the tracker comes to your inbox.
Frequently Asked Questions
What’s a good RIT score for a 1st grader?
NWEA publishes grade-level norms (averages by grade and testing season) in their official norms document. Pull the current numbers directly from the NWEA site rather than relying on a blog post number. The percentile on your child’s report tells you where they fall relative to those norms.
What’s a good RIT score for a 3rd grader?
Same answer. The current norms are on NWEA’s site, and they’re updated every few years. The most recent update was 2025. Your child’s percentile is the most useful number on the report — it does the comparison work for you.
How do RIT scores compare to grade levels?
They don’t, exactly — and that’s intentional. RIT measures what skills a student is ready to learn next; grade level measures expected curriculum exposure by age. A student can be on grade level by curriculum but score above or below the grade-level RIT norm.
Is a low RIT score bad?
“Low” depends on context. A score below the grade-level norm doesn’t automatically signal a problem — about half of all students score below the average by definition. What matters more is the trajectory: is the student growing across testing windows? A below-average score with strong growth is a different situation than a below-average score that’s dropping.
My child’s RIT score went down. Should I worry?
Not necessarily. The MAP test has a measurement error of a few points. A score that drops 3-5 points isn’t always real change — it could be measurement noise, a hard testing day, or a student who clicked through the last items quickly. Look at the broader trend across multiple testing windows before drawing conclusions.
What’s the difference between RIT and percentile?
The RIT score is an instructional level — it tells you what skills the student is ready to learn next. The percentile is a comparison — it tells you how the student’s score ranks against peers in the same grade and season. Use the RIT for instructional planning. Use the percentile for “is this okay” comparisons.
How much should my child’s RIT score grow each year?
Expected annual growth varies by grade and starting RIT. Younger students typically grow more points per year than older students — a kindergartener might grow 15-20 RIT points across a year, while a 7th grader might grow 4-6. NWEA’s norms document includes growth norms with the exact numbers.
What changed with the 2025 NWEA norms?
NWEA periodically updates norms based on new national samples. The 2025 update reflected current student performance data, which means percentile bands shifted slightly compared to older norms. If you’re comparing your student’s score against a percentile from before 2025, the comparison may not be accurate. Use current norms.
Can I help my child improve their RIT score at home?
Direct test prep isn’t the most useful approach — MAP is adaptive and tests across many skills. The better approach is supporting whatever skill area the report flags as a focus. If your child’s lowest domain is informational text comprehension, read non-fiction together. If it’s multiplication fluency, practice math facts in casual ways. The score reflects skill development; the practice should be skill-focused, not test-focused.
Stop the guessing game….
When parents and teachers see the same roadmap, everything changes for the child in between.

For the full index of all K-5 RIT bands, see RIT Band Activities.
Save This for Later
Pin this so you have it the next time scores arrive — fall, winter, and spring. The framework stays the same; the numbers shift each season.
Final Thoughts
The honest answer to “what RIT score should my student have” is “the one that lets you see what they’re ready to learn next.” The percentile tells you how that compares to peers. The domain breakdown tells you what to focus on. The trend across testing windows tells you whether the work is paying off.
One number is a snapshot. The story is in the pattern over time — and the work you do between testing windows is what shapes that pattern.