How to Read Your Student’s MAP Report: A Step-by-Step Walkthrough for K-5 Teachers
You logged into NWEA, opened a Student Profile, and saw four numbers, three percentile rankings, two graphs, and a list of skill statements. You’re not sure which number to trust, which one your principal will ask about, or what any of it has to do with the worksheet you’ll pull tomorrow.
This is the post for that. It walks through every section of the MAP report in plain language, points out what to look at first, what to ignore in the early weeks, and how to turn the report into something you can actually use on Monday morning. Built for K-5 teachers and interventionists.
There’s a free score tracker at the bottom. Grab it before you start interpreting reports — having one place to write the numbers down makes the rest of this much easier.
Why MAP Reports Feel Hard to Read
The NWEA platform is great, and the report format is overwhelming. The Learning Continuum lists hundreds of skill statements. Domain breakdowns show numbers in three different scales. Percentile rankings sit next to RIT scores that aren’t on the same scale at all. Most teachers were never given a 30-minute walkthrough — just a login.
That’s the gap this post fills. The good news: you don’t need to understand every section equally. There are three things on the report that matter most for your weekly planning, and the rest is reference material for when you have a specific question.
The Three Numbers That Matter Most
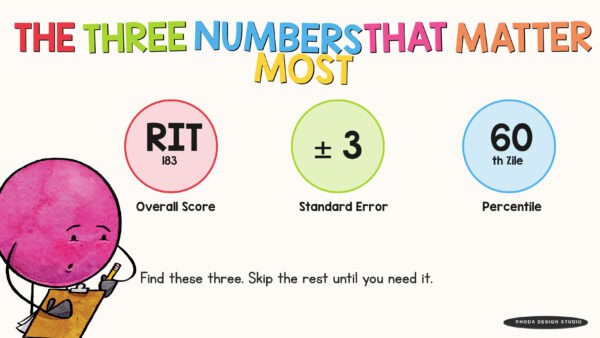
Before you scroll through anything else, find these three numbers on your student’s report:
- The overall RIT score: the single number that tells you what skills the student is ready to learn next
- The RIT range (or standard error): the score’s confidence interval — usually shown as a plus-or-minus number
- The percentile ranking: how this student compares to the national norm sample for their grade
If you do nothing else with the report, knowing these three numbers per student gets you 80% of the way to a defensible small-group plan. Everything else on the report is detail you can come back to when a specific question arises.
Section 1: The Overall RIT Score
The overall RIT score is the headline number. It’s a single integer, usually somewhere between 120 and 240 for K-5 students. RIT stands for Rasch Unit, which is a measurement scale that tells you the difficulty level of items the student is consistently answering correctly.
What the RIT score actually tells you
A RIT score is an instructional level, not a grade level. A 3rd grader at RIT 175 in math is ready to learn the same skills as a 1st grader at RIT 175 in math. The grade is irrelevant — the score tells you where to start instruction.
This is the single most important shift in how you read the report. If you keep thinking “RIT 175 is below 3rd grade level,” you’ll spend your time documenting the gap. If you think “RIT 175 is the level this student is ready to work at right now,” you’ll spend your time teaching.
What the RIT score does NOT tell you
- It does not tell you anything about effort, attention, or attitude
- It does not tell you whether the student understood the questions
- It does not predict end-of-year performance with certainty — it’s a snapshot
- It does not replace your professional judgment about what the student needs
The RIT score is a starting point for instructional decisions, not a final verdict on the student.
Section 2: The RIT Range (Standard Error)
Right next to the overall RIT score, you’ll see a plus-or-minus number. It might look like “183 ± 3” or be displayed as a range like “180-186.” This is the standard error of measurement — the confidence interval around the score.
Why this number matters
If a student scored RIT 183 with a standard error of 3, their “true” score on the day of testing is somewhere between 180 and 186. That matters when:
- Comparing scores between testing windows. A fall score of 183 and a winter score of 185 isn’t real growth — it’s within the standard error of both tests.
- Drawing the line between two RIT bands. A student at 180 with an error of ±3 might really be at 183 — close enough to either band that you check both before grouping.
- Talking to parents. “Your child scored in the range of 180-186” is more honest than “Your child scored 183.” Both are true; one is more accurate.
You don’t need to memorize standard error rules. You just need to know that small score differences across a single testing window aren’t always meaningful, and to plan accordingly.
Section 3: The Percentile Ranking
The percentile shows where your student falls compared to the national norm sample for their grade level at the same testing window. A 3rd grader who scored RIT 195 in fall might land at the 60th percentile, meaning they outscored 60% of 3rd graders nationally in fall.
When to look at the percentile
- When a parent asks “how is my child doing compared to other kids” — the percentile is the answer they’re looking for
- When you’re flagging students for Tier 2 or Tier 3 intervention — many schools use percentile cutoffs (e.g., below the 25th percentile triggers Tier 2 review)
- When you’re writing IEP present-levels — percentile is often required language
When to ignore the percentile
For day-to-day instructional planning. Percentile tells you “how does this kid compare to others.” RIT score tells you “what does this kid need next.” For Monday-morning planning, the RIT score wins. The percentile is for reporting up — to administrators, to parents, to documentation files.
A common mistake: using the percentile to decide instructional level. Two students at the 50th percentile in different grades need very different instruction. Use the RIT score for that.
Section 4: Domain (Goal) Scores
Below the overall RIT score, the report breaks the score into domains. NWEA calls these “goals” or “instructional areas.” For Math, the domains include Operations & Algebraic Thinking, Numbers & Operations, Geometry, and Measurement & Data. For Reading, domains include Foundational Skills (where applicable), Literature, Informational Text, Vocabulary, and Language & Writing.
What to look for in domain scores
The question to ask is: are the domain scores even, or are they uneven?
- Even scores (all domains within ~5 RIT points of each other): the overall RIT score is a fair representation of the student. Plan from the overall score.
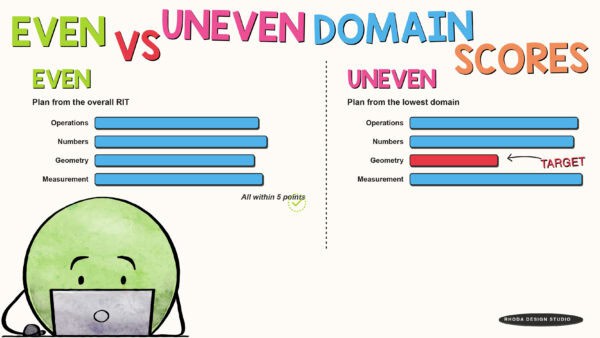
- Uneven scores (one domain 8+ points lower or higher than the others): the overall score hides something. Plan from the lowest domain — that’s where the student needs targeted support.
For example: a student with overall RIT 195 in math, but Geometry at 180 and Operations at 205, doesn’t really need on-grade-level instruction across the board. They need targeted geometry intervention while you keep them on grade-level for operations.
A caution on domain scores
Domain scores have larger standard errors than the overall RIT score because each domain is measured by fewer items. A 5-point gap between domains might be real — or it might be measurement noise. Trust the domain breakdown when the gaps are 8+ points and consistent across testing windows. Be skeptical of small gaps that flip between testing windows.
Section 5: The Learning Continuum
The Learning Continuum is the long list of skill statements at each RIT range. NWEA generates it for every student, showing what skills they’re “developing,” “ready to develop,” or have “mastered” at their current RIT.
Why this section overwhelms most teachers
Because the Continuum lists dozens of skills per band. If you try to read every skill statement for every student, you’ll spend hours and end up no closer to a Monday plan. Teachers tell us this all the time — the data is wonderful, the format is unusable.
How to actually use the Learning Continuum
- Pick one skill cluster, not the whole list. Look at the “ready to develop” section for the student’s lowest domain. Pick one skill from there. That’s your priority skill for the next two weeks.
- Don’t address skills above the student’s range. The Continuum will list skills the student is “developing” at higher RIT levels. Skip them. They’re aspirational, not actionable.
- Don’t worry about the “mastered” list. The skills below the student’s current range are noise for planning purposes. The student already has them.
If you remember nothing else from this section: the Learning Continuum is a reference document, not a to-do list. Skim it, pick one skill, close the tab.
Section 6: Growth Projections (Spring Onward)
Starting with the second testing window of the year, the report will show growth from the previous test. NWEA also projects expected growth based on national norms.
What “expected growth” actually means
Expected growth is the average score change for students at the same starting RIT and grade. It is NOT a target your student must hit. It’s a comparison point. A student who matches expected growth is growing at the average rate for similar peers. A student who exceeds it is growing faster than average. A student below it is growing slower.
When growth data feels demoralizing
Schools sometimes treat expected growth as a hard target — call you in individually if a student didn’t grow, expect a written explanation, attach growth percentages to evaluations. That pressure is real, and it’s not your fault when a kid has a bad testing day or a hard semester. The growth projection is one data point among many, not a verdict on your teaching.
Documentation matters here. If you can show what intervention you ran, what skills you targeted, and how the student progressed within the intervention, you have evidence beyond the test score itself. That’s what your RIT Intervention System tracker and goal cards are for — they capture the work that the test alone doesn’t.
Stop the guessing game….
When parents and teachers see the same roadmap, everything changes for the child in between.

For the full index of all K-5 RIT bands, see RIT Band Activities.
Putting It All Together: A 5-Minute Report Read
Here’s the workflow for reading a Student Profile in five minutes or less:
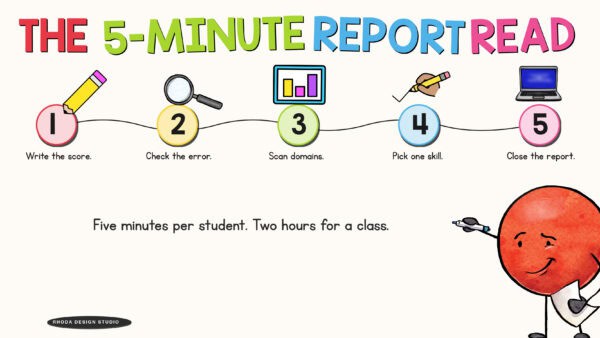
- Minute 1: Write the overall RIT score and percentile in your tracker
- Minute 2: Glance at the standard error. Note if the score is at the edge of a RIT band where the error matters.
- Minute 3: Scan the domain breakdown. Are the scores even or uneven? If uneven, which domain is lowest?
- Minute 4: Open the Learning Continuum for the lowest domain. Pick ONE skill from “ready to develop.” Write it in the tracker.
- Minute 5: Close the report. You have what you need.
Five minutes per student × 25 students = roughly two hours for a full class. That’s the setup work. Once you have it in the tracker, you reference the tracker for the rest of the term — not the report.
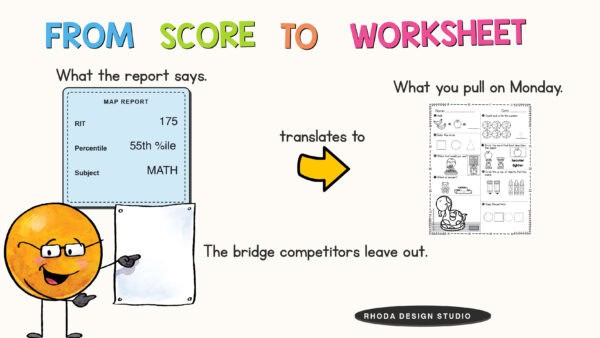
From Score to Worksheet: The Translation Step
Reading the report is half the job. The other half is connecting “RIT 175” to “what worksheet do I pull on Monday.” This is the part competitors leave out — they assume you can bridge the score to the materials. Most teachers can’t, and that’s not a failing. The bridge isn’t documented anywhere.
Here’s the rough translation by RIT cluster for K-5:
RIT 121-140: Foundational
Math: counting with meaning, numeral recognition, basic shapes, one-to-one correspondence. Reading: letter recognition, beginning sounds, matching letters to pictures. Pull manipulative-heavy worksheets and short, hands-on practice. The kid is not yet ready for paper-and-pencil drill.
RIT 141-170: Early Numeracy and Phonics
Math: number sequencing within 20, addition and subtraction within 10, simple story problems, ten-frame work. Reading: blending sounds, sight words, rhyming, CVC patterns, ask-and-answer questions. Pull worksheets that move from concrete (objects) to representational (pictures and ten frames).
RIT 171-200: Operations Within 100 and Reading Fluency
Math: addition and subtraction within 20 and 100, place value to two and three digits, basic measurement, multiplication as repeated addition. Reading: multisyllable words, fluency at sentence and short-paragraph level, main idea, character traits, context clues. Pull standard worksheet packs at this level — most curricula are designed for it.
RIT 201-230: Multi-Digit Operations and Inference
Math: regrouping with two and three digits, multi-step word problems, multiplication and division facts, fractions, elapsed time. Reading: point of view, inference, text structure, figurative language, reference materials. Pull worksheets that combine fluency with reasoning.
For more granular activity ideas at each band (in 10-point increments rather than these 30-point clusters), see math fluency activities by RIT band and reading fluency activities by RIT band.
Free MAP Score Tracker
The score tracker is a one-page-per-class document with columns for fall, winter, and spring scores plus seasonal goal cards. It includes:
- A roster row per student
- Math and reading columns side by side
- Notes space for priority skills and group placement
- Seasonal goal cards for fall, winter, and spring
- A version formatted for MTSS documentation
Drop your email below and the tracker comes to your inbox.
Frequently Asked Questions
What does a RIT score mean?
A RIT score is a number on the NWEA scale that represents what skills a student is ready to learn next. It is not a grade level. Two students at the same RIT need similar instruction, even if they’re in different grades.
What is a RIT band?
A RIT band is a 10-point range on the RIT scale (e.g., 171-180). Bands group students who are working on similar skills, which makes small-group planning much faster than working with individual scores.
How do RIT scores convert to grade levels?
They don’t, exactly — that’s intentional. NWEA publishes grade-level norms (the average RIT for each grade at each testing window), but a RIT score is not a grade-level equivalent. Use the norms to compare your student to peers; use the RIT score itself to plan instruction.
What’s a good RIT score for a 3rd grader?
NWEA publishes grade-level norms periodically. Pull the most current norms document directly from the NWEA site rather than relying on a number from a blog post (norms are updated every few years and current numbers should come from the source). The percentile on your student’s report tells you where they fall relative to those norms.
How do I read my student’s MAP report?
Start with three numbers: overall RIT score, standard error (the ± number), and percentile. Then check whether the domain scores are even or uneven. If uneven, plan from the lowest domain. Pick one skill from the Learning Continuum’s “ready to develop” section. Write it in your tracker. Done.
What does it mean if my student didn’t grow on MAP?
Several things, and not all of them are about your teaching. Standard error means small score changes aren’t always real. A bad testing day can suppress a score. The student may have grown in skills the test didn’t measure. Document what you taught, what you targeted, and what the student showed in your work — that’s evidence beyond the score.
Can I use MAP data for IEPs and 504s?
Yes. MAP data is a valid academic measure for IEP present-levels and goal-setting. Pair it with curriculum-based measures and your own observations. Most special education teams welcome it because it’s standardized and trackable across years.
What’s the difference between RIT score and percentile?
The RIT score tells you what to teach next. The percentile tells you how the student compares to peers nationally. Use the RIT score for instructional planning. Use the percentile for reports, parent conversations, and intervention referrals.
How often should I read the report?
Once at the start of each testing window — fall, winter, spring. After that, work from your tracker. The report is a snapshot, not a daily reference. Going back to it weekly creates more anxiety than insight.
Save This Walkthrough
Pin this so you can come back to it the next time scores arrive. Reading the report gets faster every window — but the workflow stays the same.
Final Thoughts
The MAP report has a lot in it, and most of it is reference material. Three numbers — overall RIT, standard error, percentile — plus one priority skill from the lowest domain. That’s the read. Five minutes per student. Two hours for a class. Then you close the report and work from your tracker for the rest of the term.
Grab the score tracker, work through your reports this way, and the next time someone asks “what does RIT 178 mean?” you’ll have an answer that ends with “and here’s what we’re working on.”