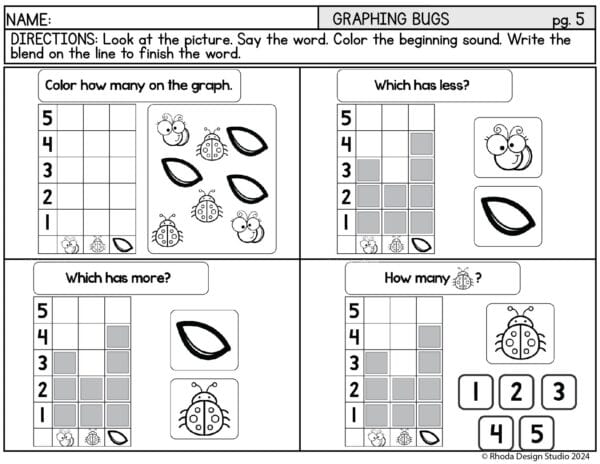
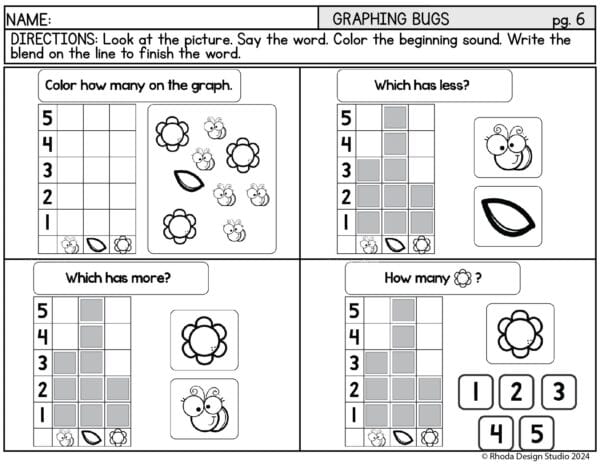
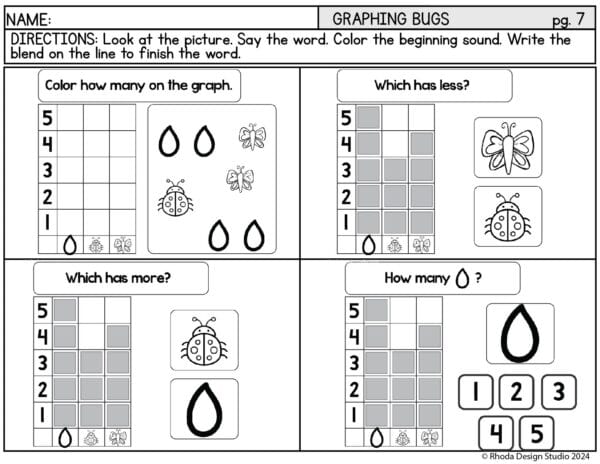
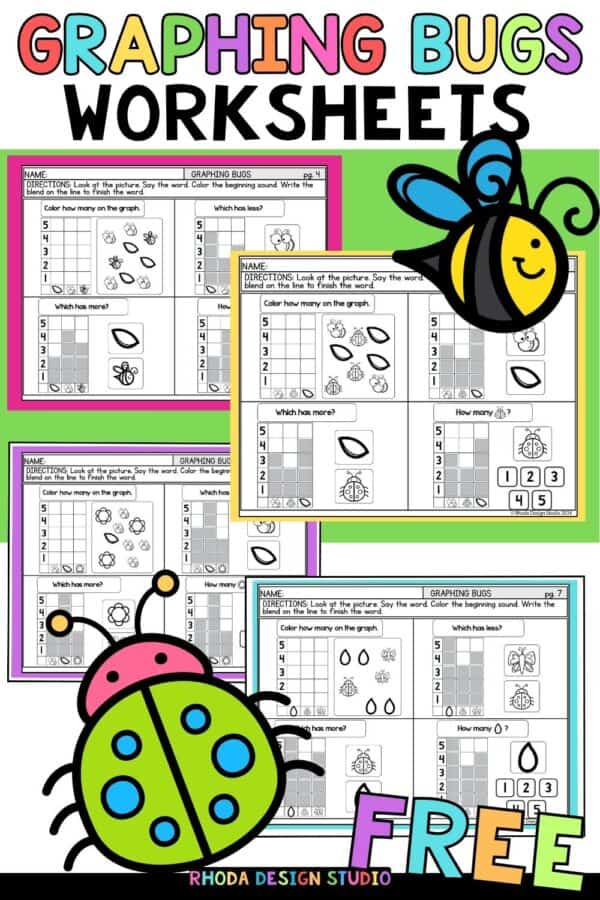
8 Spring Kindergarten Graphing Worksheets
Graphing can be a fun and excellent way to introduce young children to math concepts. This spring-themed kindergarten graphing worksheet not only builds graphing skills but also includes activities that enhance sorting, counting, and observation skills. Whether you’re a parent, kindergarten teacher, early educator, or homeschooling, consider this guide as your toolkit for an engaging graphing experience in the classroom or at home.
Getting Started: The Graphing Basics
Before we spring into action, it’s important to ensure that your little learners have an understanding of what a graph is and what it’s used for.
What is a Graph?
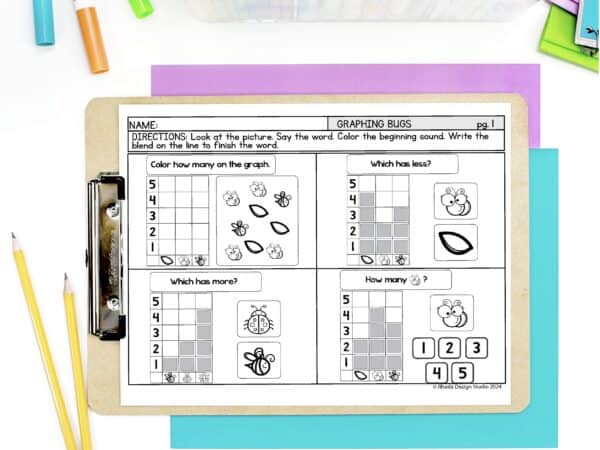
A graph is a visual representation of data. In the simplest terms for kindergarten children, a graph can be thought of as a picture that shows information in an organized way. It helps us understand and compare different amounts or categories.
Types of Graphs
For kindergarten level, we’ll focus mainly on two types:
- Bar Graphs: A bar graph uses bars of different lengths to indicate the values it represents. This is a great way to show comparisons of discrete categories of data.
- Picture Graphs: Similar to a bar graph, a picture graph uses pictures (or icons) to represent data. Each picture can represent one or more units, making it easier for young children to comprehend.
Engaging Graphing with Bugs
Spring is a time when bugs start to come out, and what better way to celebrate this season than by graphing some of these fascinating creatures?
Preparation
Gather materials:
- A large sheet/table for drawing and labeling the graph
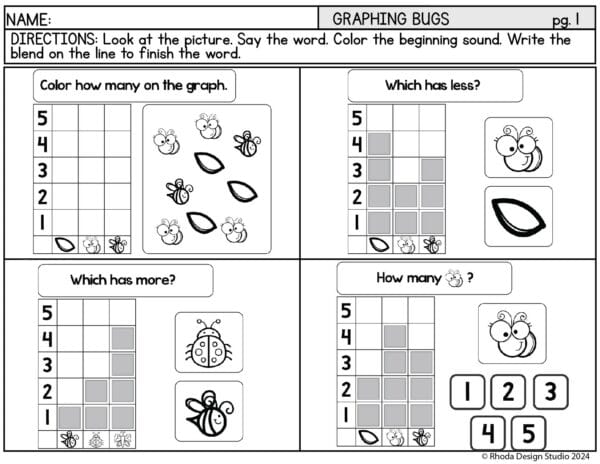
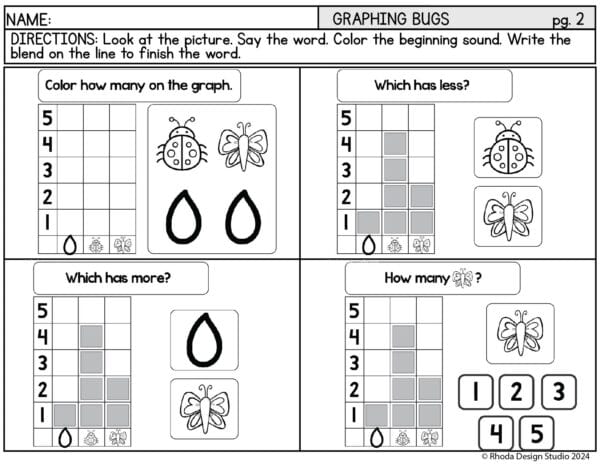
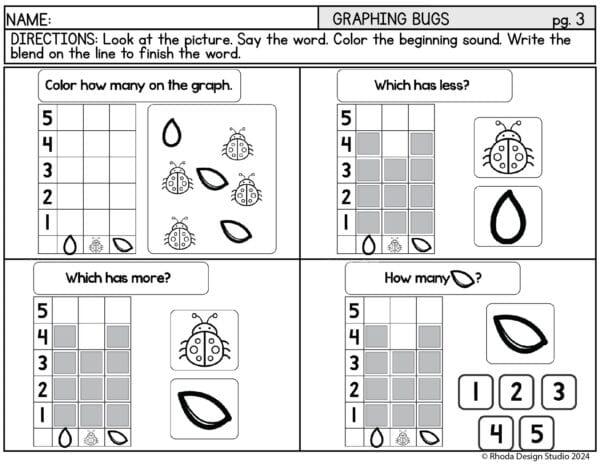
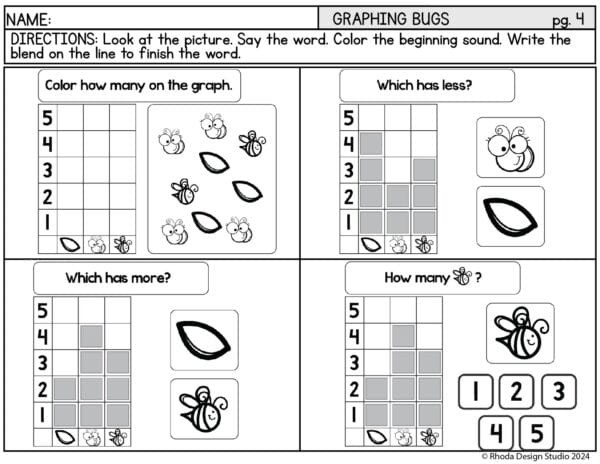
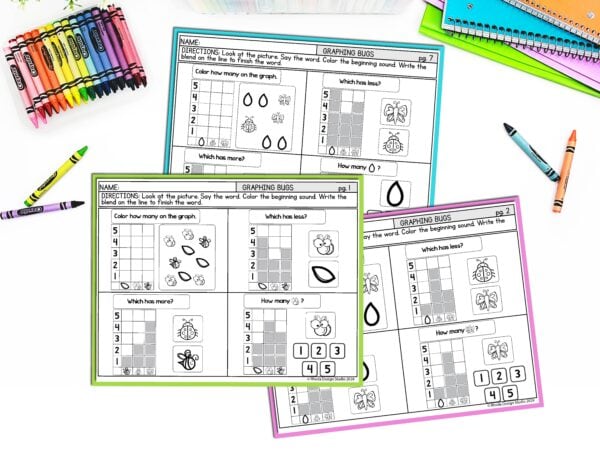
- A printable graphing worksheet or create your own with columns for each bug type
- Pencils, crayons, or markers for drawing and coloring
- Stickers or cut-out bug pictures (optional)
Instructions
- Introduce the Bugs: Show the children different bugs (or pictures of them). Discuss each type – their characteristics and where they might be found.
- Graph Header: On your graph sheet, write the title ‘Spring Bug Graph’. Discuss the purpose of the title and what a graph title tells us.
- Labeling the Graph: Create a column for each bug type (e.g., ladybugs, bees, butterflies, and caterpillars) and label the columns accordingly.
- Collecting Data: Depending on your classroom or location, you might have the children go outside to find real bugs, use stickers, or draw bugs on their own. For each bug observed, add a corresponding mark (or color a segment/picture) in the appropriate column on the graph.
- Analyzing Data: After the graph is filled, discuss which bug had the most, least and equal number of observations. Encourage questions about the graph, and guide them to make observations, such as “Which bug do we see more often in the spring?” and “How many more butterflies than bees do we have?”
- Reflection & Extension: Use the gathered data from the graph to create math problems, such as addition (“How many bugs did we find altogether?”) and subtraction (“How many more bees are there than ladybugs?”).
One to One Counting
The foundational math skill of one-to-one correspondence is vital for young children as they learn to count and comprehend numbers. In this activity, we infuse graphing with one-to-one practice.
Materials
- A worksheet with various visual elements like shapes, patterns, objects, or characters
- A set of markers or crayons
The Exercise
- Introduction: Discuss what ‘one-to-one’ means. Explain that they will be counting the objects one at a time and matching them to a number on the graph. Show them examples using physical objects.
- Observation & Counting: Each graphing square or space on the worksheet should have one visual element. The child will count the elements, say the number aloud, and then color in the corresponding number on the graph. This reinforces counting and association of number symbols.
- Completion: Once all elements are counted and added to the graph, the child should have a picture graph. Discuss the patterns or relationships they see. For a challenge, they can create their own questions about the data, e.g., “How many red shapes do we have altogether?”
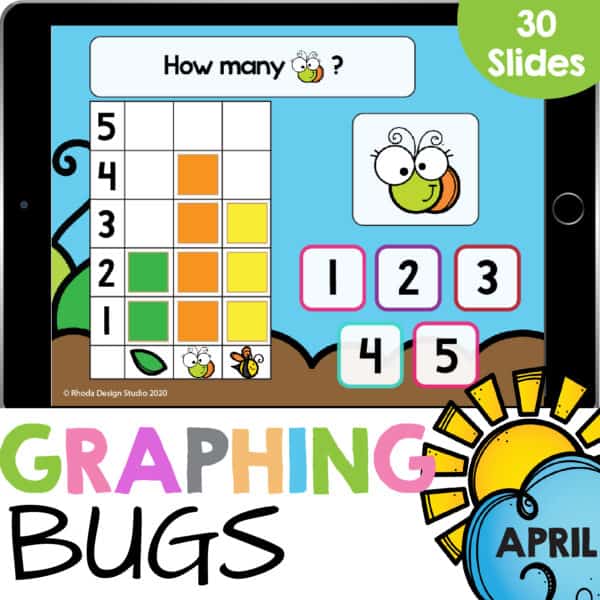
NOTE: If you would like an educational lesson that is also engaging and offers extra graphing practice, check out the Google Slides and Boom Decks that I offer. They are some of my favorite lessons to make: plus, teachers and kiddos LOVE them.
Graphing beyond the Worksheet
To truly embed graphing into your curriculum, make it a part of everyday learning.
Real-World Graphing
Encourage children to bring in their own items to graph. It could be their favorite crayon colors, types of fruit, or even their shoe sizes. This personal investment makes the graph meaningful and teaches them to represent their choices in an organized manner.
Interactive Graphing
Create interactive graphs on your classroom wall, where children can add a sticker or mark their choice each day. It could be weather conditions, types of snacks, or favorite books. They can compare data and make predictions or observations.
Graphing Games and Challenges
Make learning fun with games that involve graphing. Relay games where children collect and graph items as they run back and forth, or set up a nature ‘hunt’ where they graph what they find. Challenges like ‘Who can graph the most in one minute?’ add excitement to the learning process.
By incorporating graphing into your kindergarten activities, you not only introduce mathematical thinking but also problem-solving, observation, and categorization. Spring into action and watch as your little ones bloom with numerical literacy and a love of learning.

