Free Printable Addition Charts: Fill in the Blank Worksheets
Have you ever thought about how we can make learning math a bit more, well, fun and engaging for learners? One of the niftiest tools that I’ve come across (and wish I had paid more attention to back in my school days) is the addition chart. It’s like a treasure map that guides young explorers through the vast lands of numbers and operations, revealing hidden secrets along the way.
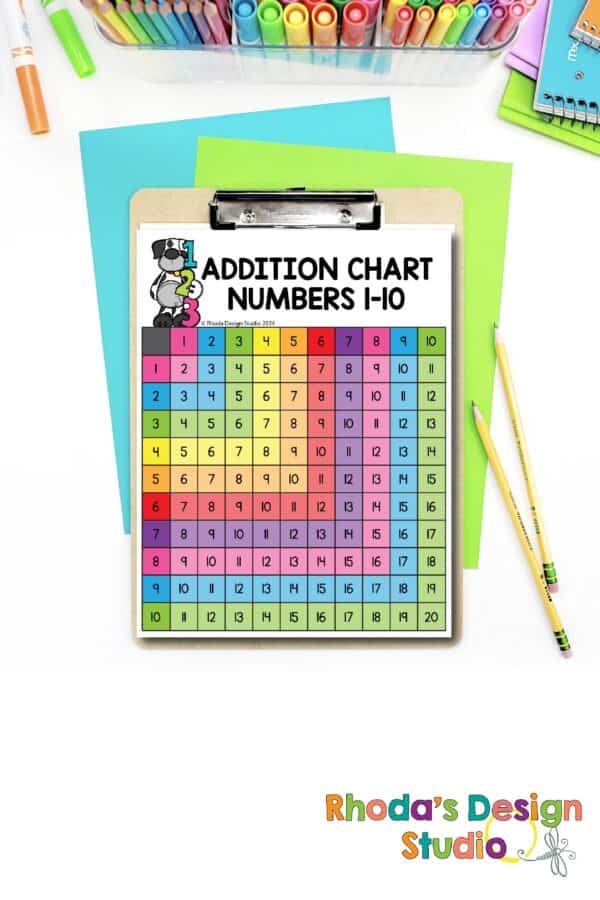
Why Addition Charts Rock
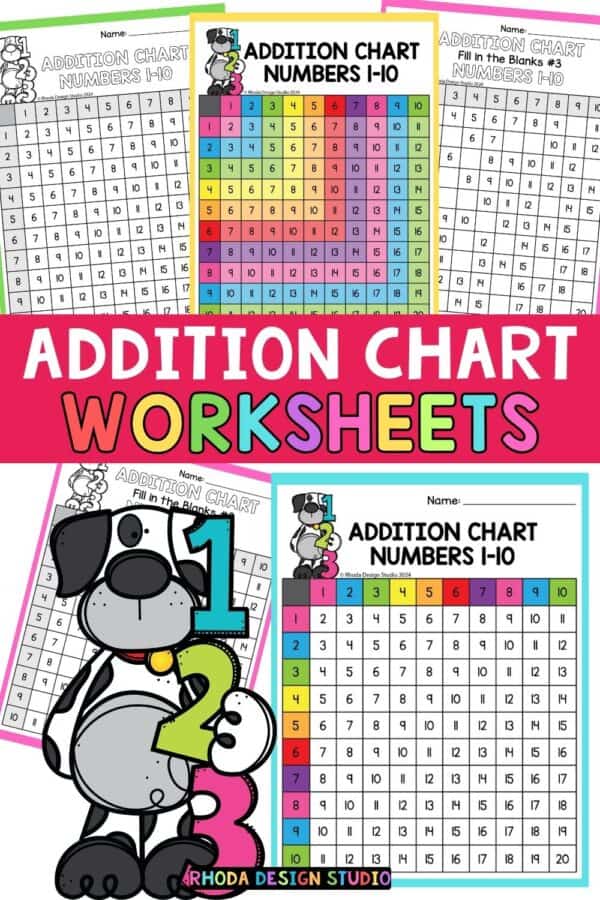
Addition charts are much more than just a grid filled with numbers. They’re a visual feast that helps students notice and explore patterns in addition. This isn’t just about finding quick answers (though it certainly helps with that); it’s about building a deep, intuitive understanding of how numbers come together.
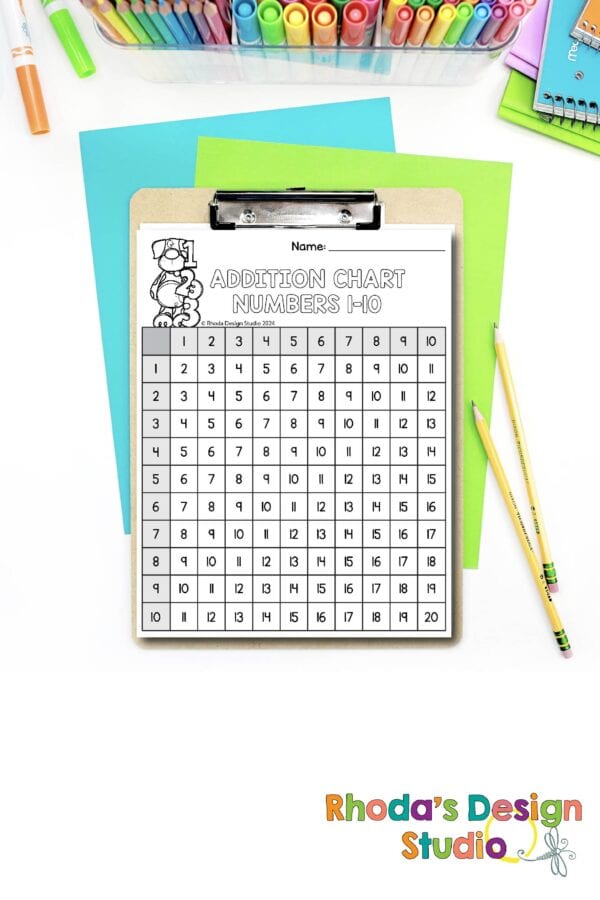
When learners start using addition charts, they’re not just memorizing facts; they’re detectives, uncovering clues about place value and how the tens and ones places dance together in the world of numbers. It’s this exploration that lays down the foundational blocks for more advanced concepts in mathematics.
Spotting Patterns: More Than Meets the Eye
Have you taken a good look at an addition chart lately? If you do, you’ll start to see that it’s teeming with patterns. For instance, as you move down a column or across a row, you’re essentially adding tens or ones. This simple observation can be an “aha” moment for many students, making addition feel less like a chore and more like a pattern-spotting game.
And here’s a little secret: spotting these patterns can also lead to cool insights about place value. For example, when adding two numbers, if you keep one number fixed and change the other, you can see how the sum increases incrementally, shining a spotlight on the concept of place value and how our number system is structured.
Making It Stick with Personal Anecdotes
Remember the time when you first rode a bike? The wobbles, the falls, and then that magical moment when you were finally riding smoothly, feeling like you were on top of the world. Learning to use an addition chart can be somewhat similar. At first, it might seem a bit overwhelming with all those numbers, but with a bit of practice, it starts to feel natural. You begin to see the patterns and how they connect to what you already know about numbers. And just like riding a bike, once you’ve got it, you’ve got it for life.
Inclusive Learning
The beauty of addition charts is that they welcome all learners. Whether you’re a visual learner who thrives on seeing patterns laid out in front of you, or someone who likes to dig into the details and understand the “why” behind the numbers, addition charts have something for everyone. They democratize learning, making the fascinating world of numbers accessible to all.
Addition Chart Worksheets
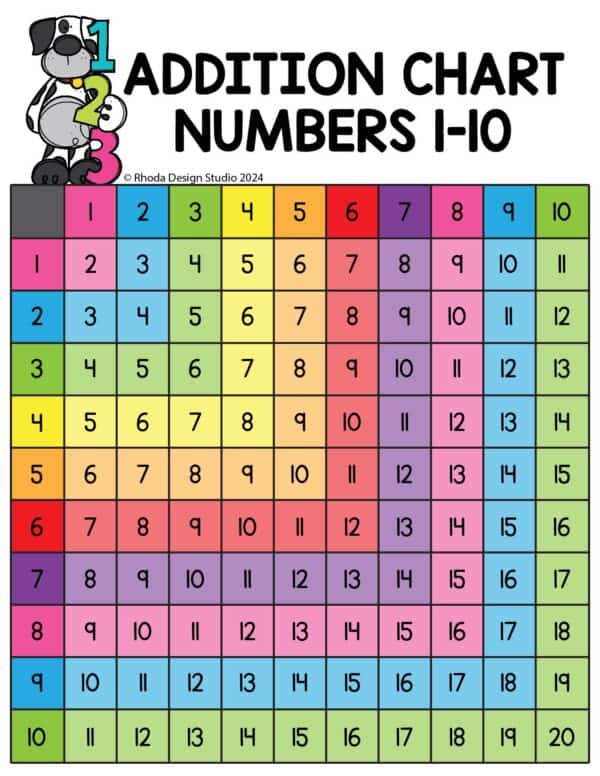
Addition Chart Poster
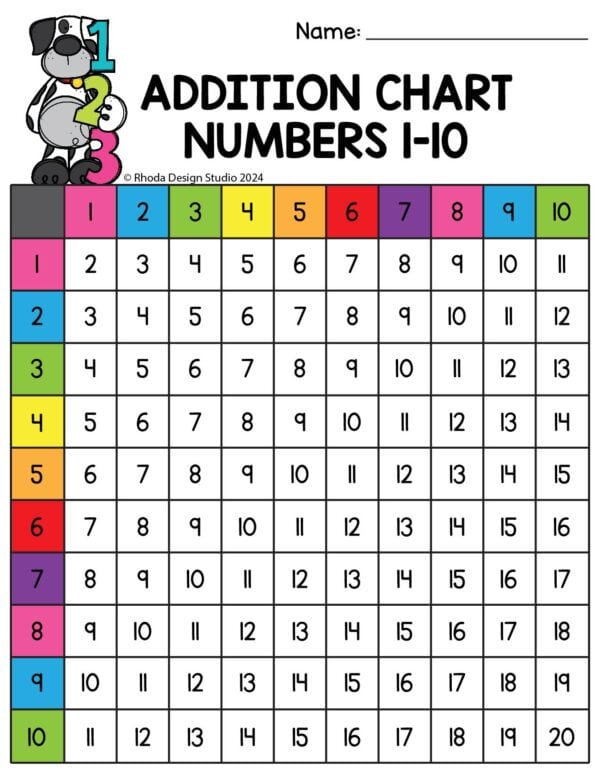
Addition Chart Numbers 1-10
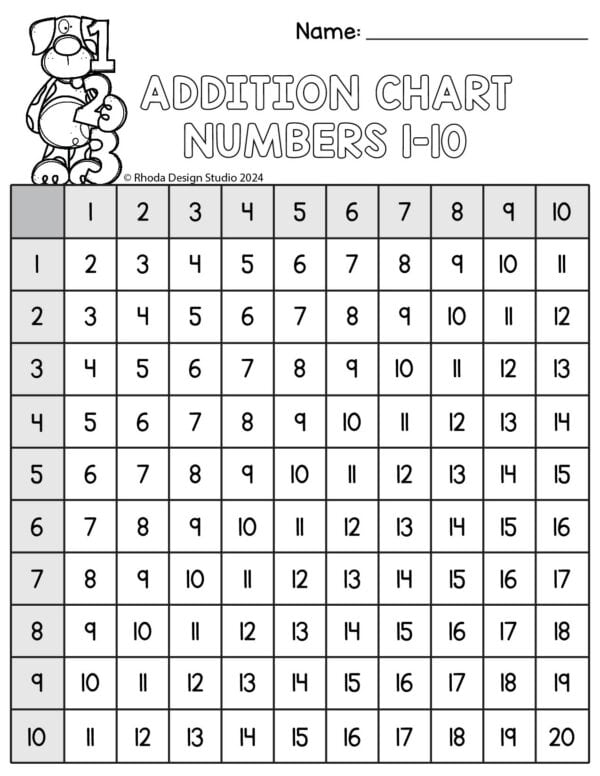
Addition Chart Up to 20
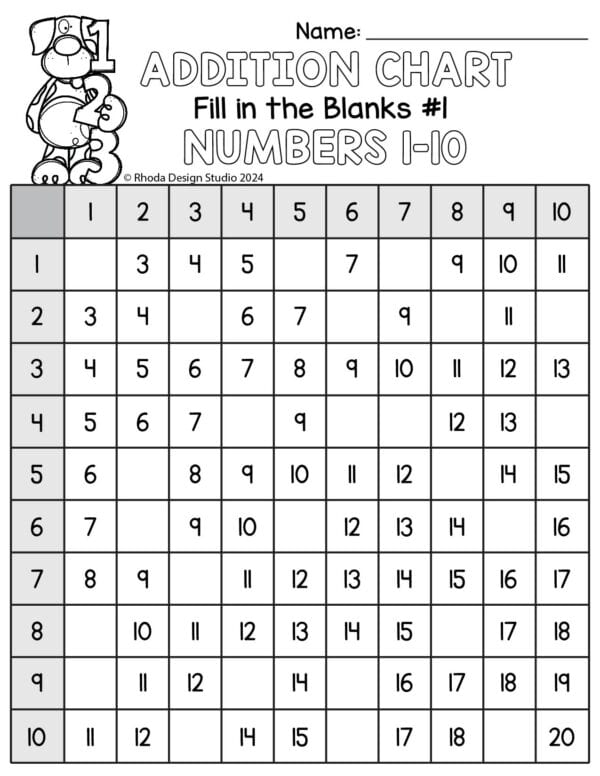
Addition Chart Fill in the Blank #1
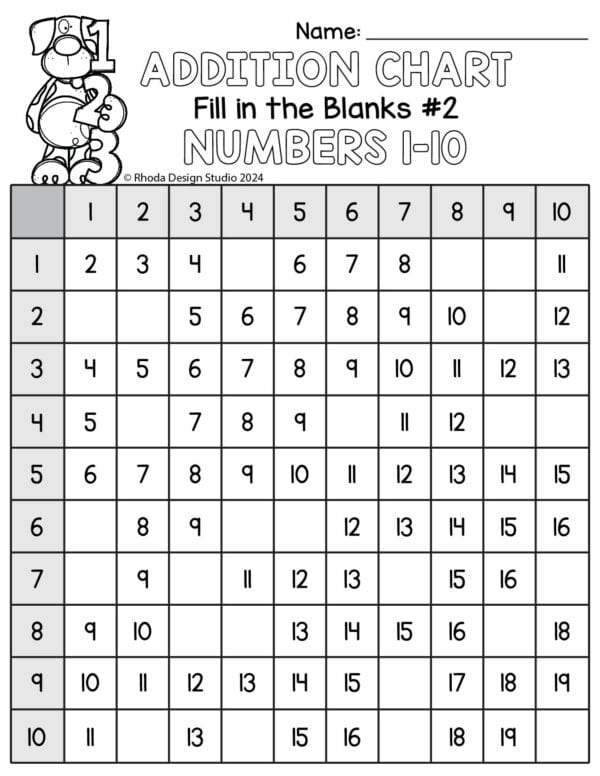
Addition Chart Fill in the Blank #2
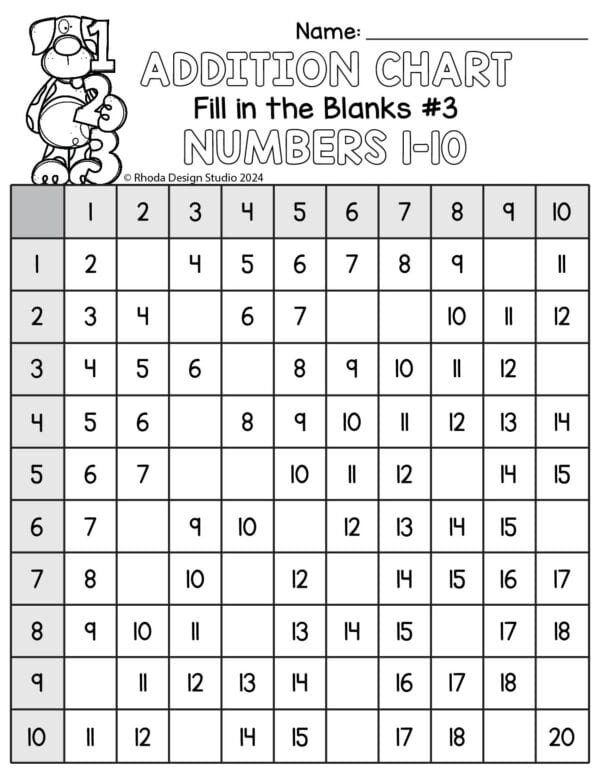
Addition Chart Fill in the Blank #3
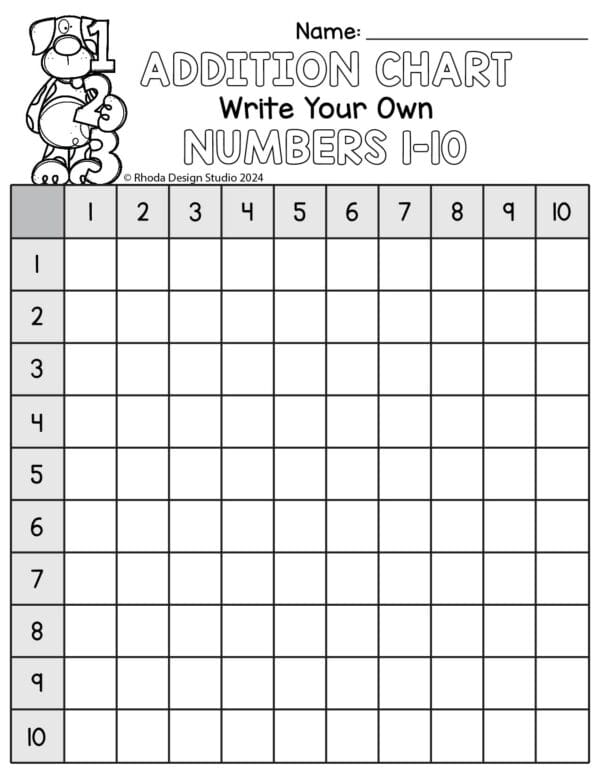
Addition Chart Fill in the Blank
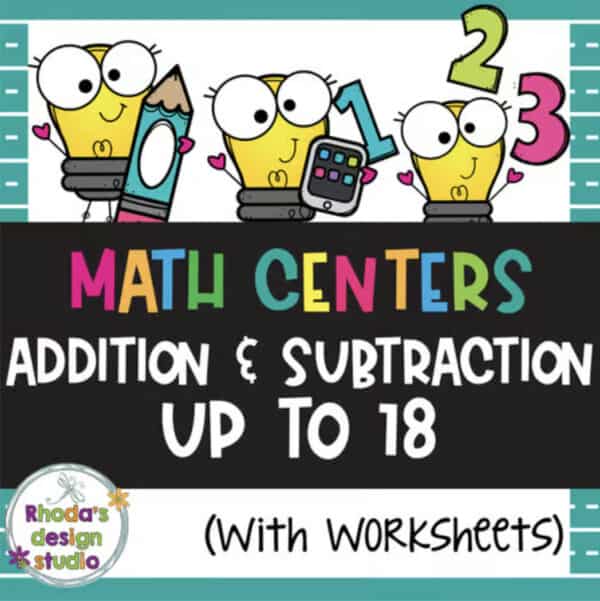
Addition and Subtraction Practice with Interactive Slide
Students will slide a set of questions through a line on the math mat. They will record the math equation on their response sheet and then solve the addition or subtraction equation.
There are two sets of questions included and worksheets that can be used to differentiate engagement. Students can copy the equations onto their papers or use a prefilled worksheet and solve the math problems.
An extra practice sheet is also included.
This is a great independent activity to practice skills and can be used for centers, small group work, or as an “I’m through, what can I do?” activity.
In the end, addition charts are more than just a learning tool; they are a gateway to understanding the beautiful and logical world of mathematics. They encourage learners to be curious, to explore, and to discover the patterns that make math so intriguing. Next time you come across an addition chart, take a moment to explore it with fresh eyes. Who knows what patterns and insights you’ll uncover?
Remember, every mathematician was once a student who learned that two plus two equals four. It’s the journey of discovery, powered by tools like addition charts, that makes the adventure exciting.
